
Infordata Completes the INSPIRE Impact Dashboard: A Milestone for River Data Integration
October 2025 · Seas and waters
Infordata has finalised the INSPIRE Impact Dashboard, delivering a unified platform for data sharing, analysis, and visualization of river pollution.
Infordata completed the structure of the Inspire Impact Dashboard for both private and public areas of the web tool.
Private workspace (researchers): secure access for uploading datasets, running analyses, and viewing detailed telemetry and models.
Public workspace (stakeholders): open views that showcase project progress, with summary statistics, interactive charts, and maps for broader communication and engagement. What’s new (latest releases):
- 3D globe with Riverline integration: explore a 3D interactive map linked to the Riverline database, now exposing ~24,000 georeferenced records with drill-downs to key attributes.
- Hydrodynamic & transport views: animated model visualizations (e.g., Douro River) show flow dynamics and microplastic transport pathways to support hypothesis testing and scenario analysis.
- European river pollution insights: a dedicated section aggregates modeled indicators for river pollution across Europe, with partner-provided datasets to compare pollution levels, statistics, and microplastic accumulation.
- AI-enabled sensing: first production connection of our AI-assisted sensor stack captures vibration, flow/throughput, and water-quality metrics upstream and downstream of technologies—supporting performance diagnostics and yield estimation.
- LCA roll-out: initial Life Cycle Assessment (LCA) results for selected technologies are now published in the dashboard; additional technologies will follow as verification is completed.
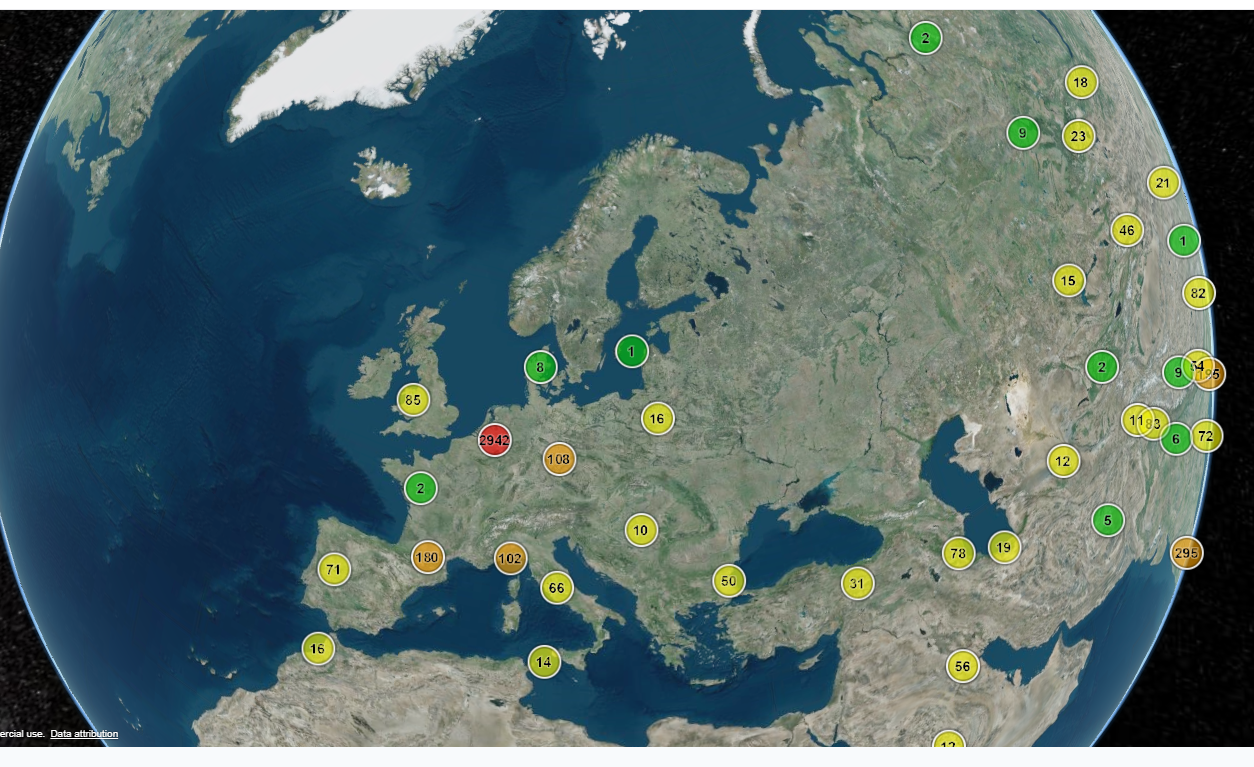
3D map of RLDB
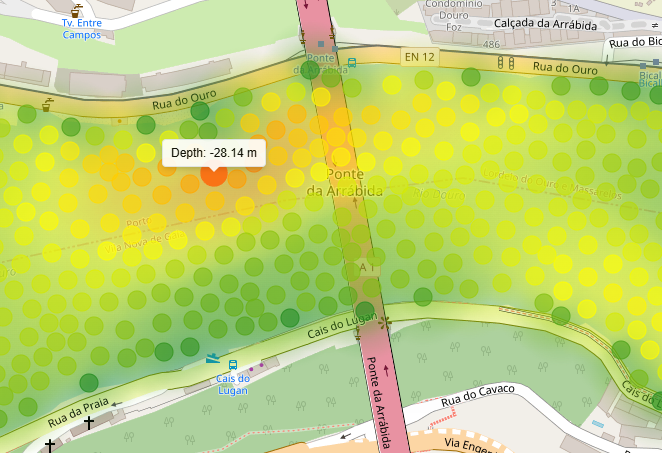
River Duoro Modelling2
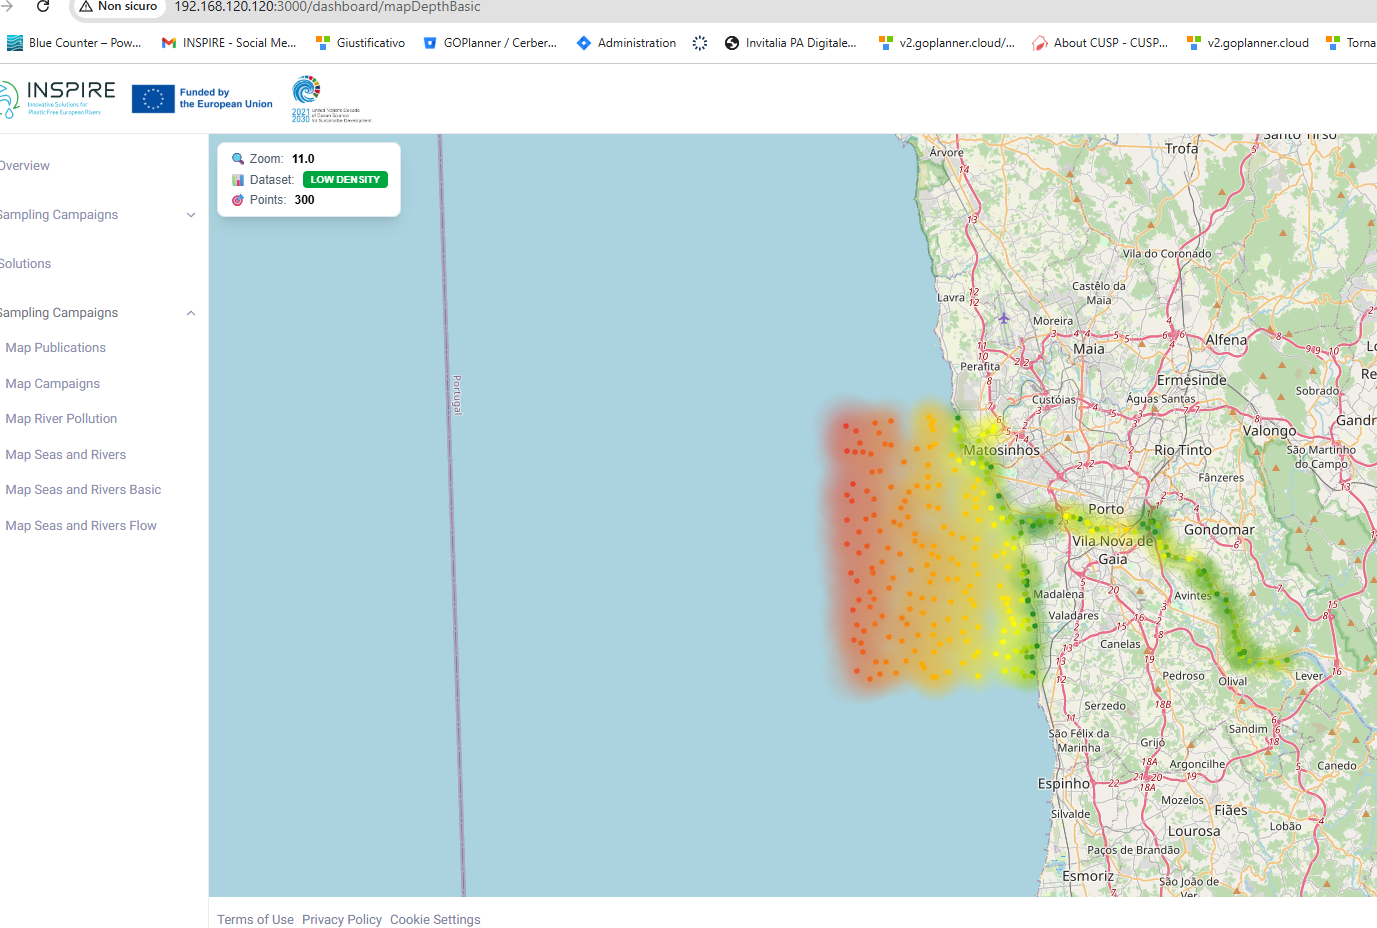
River Duoro Modelling1
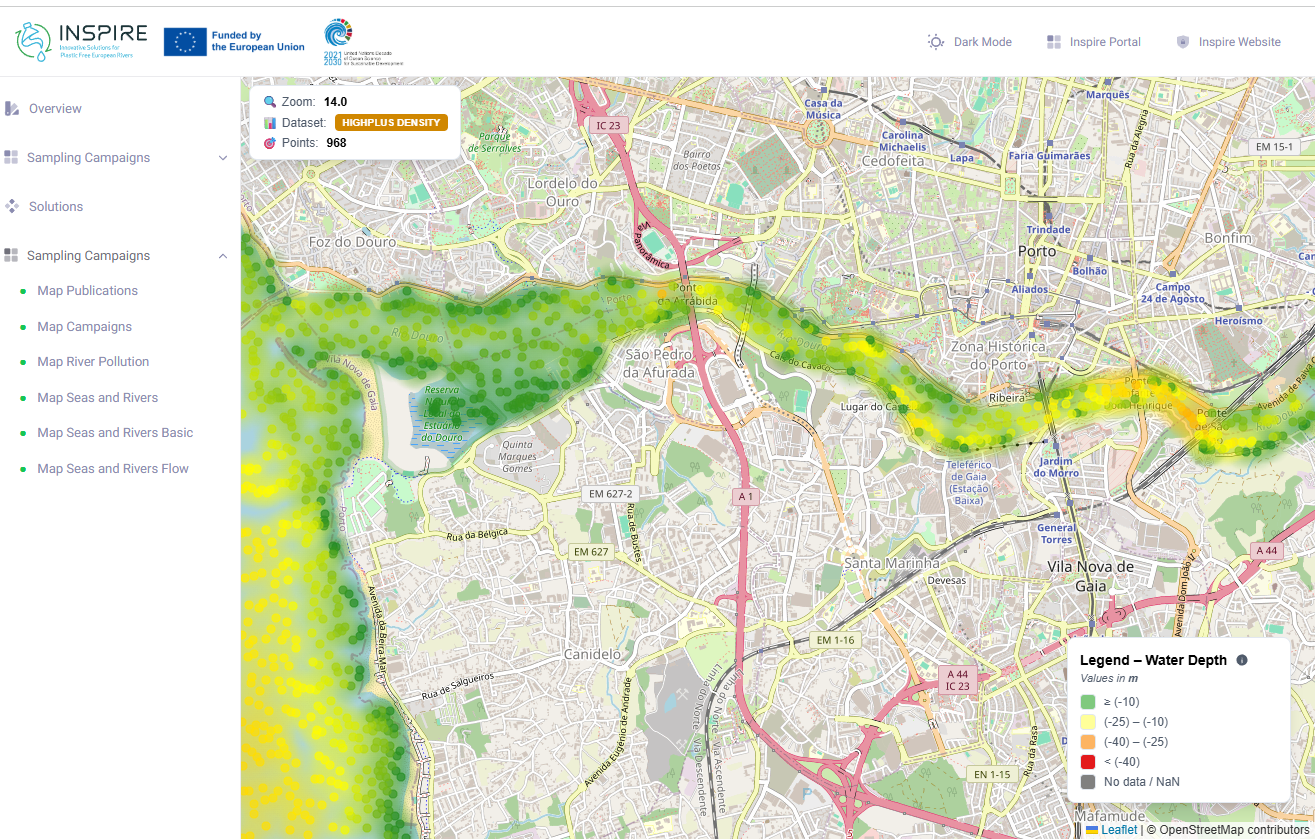
River Duoro Modelling3
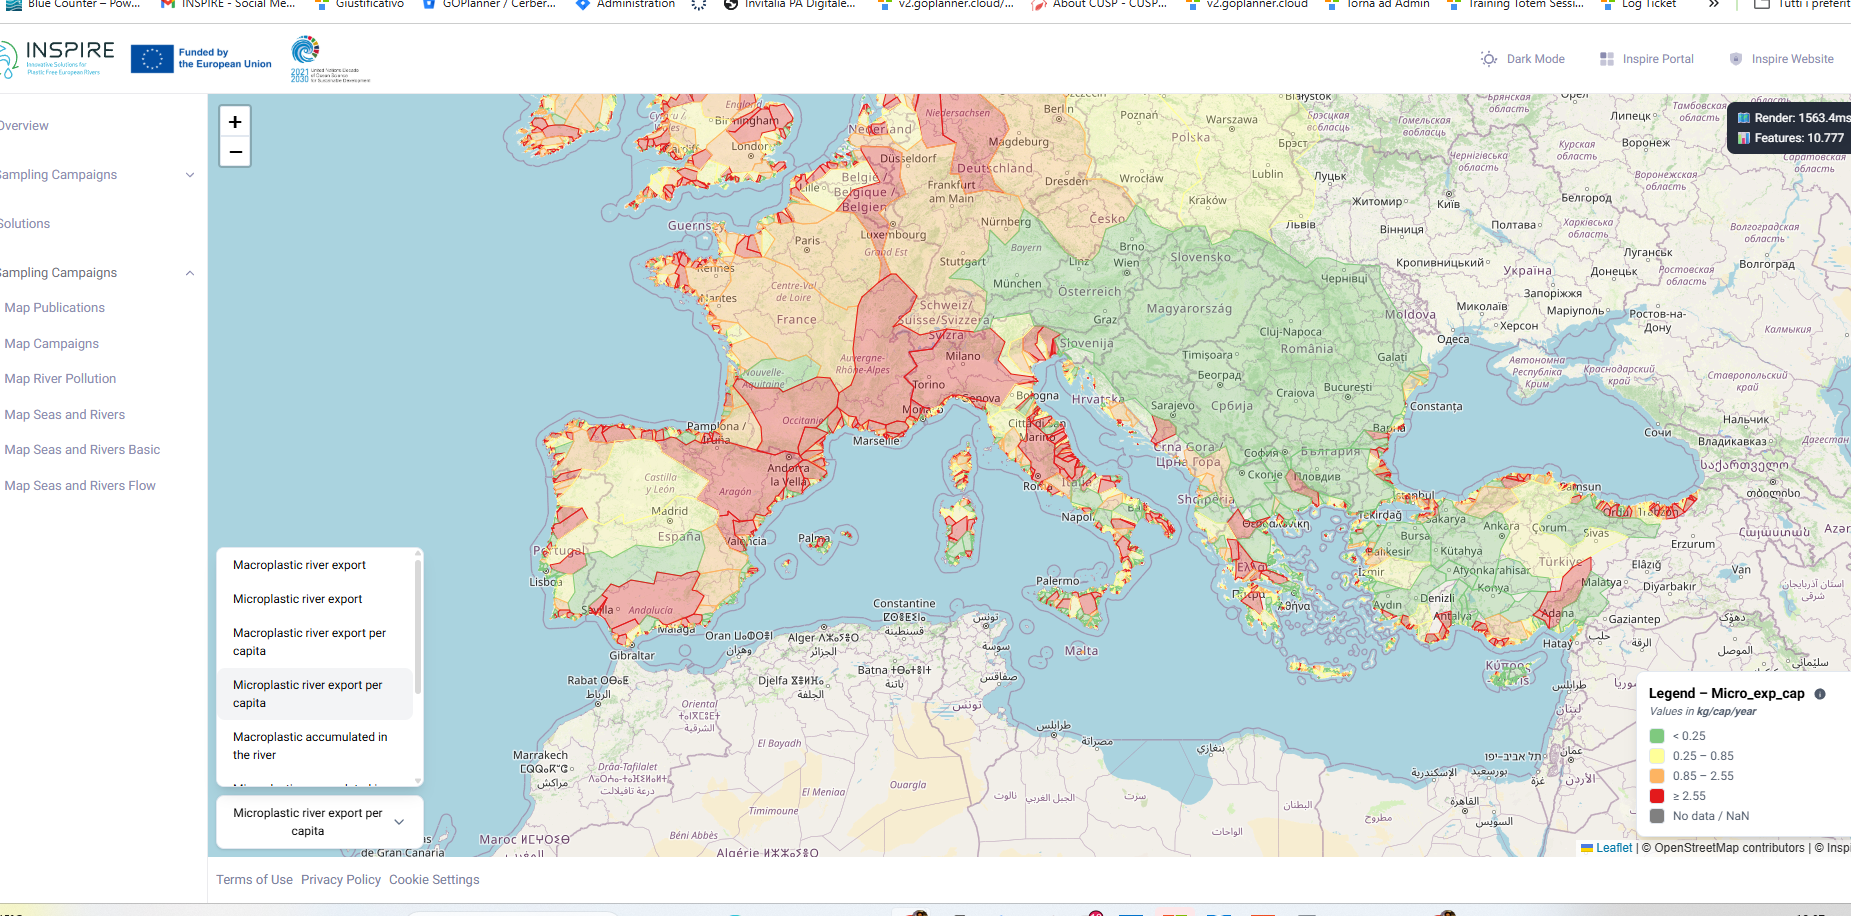
River Pollution1
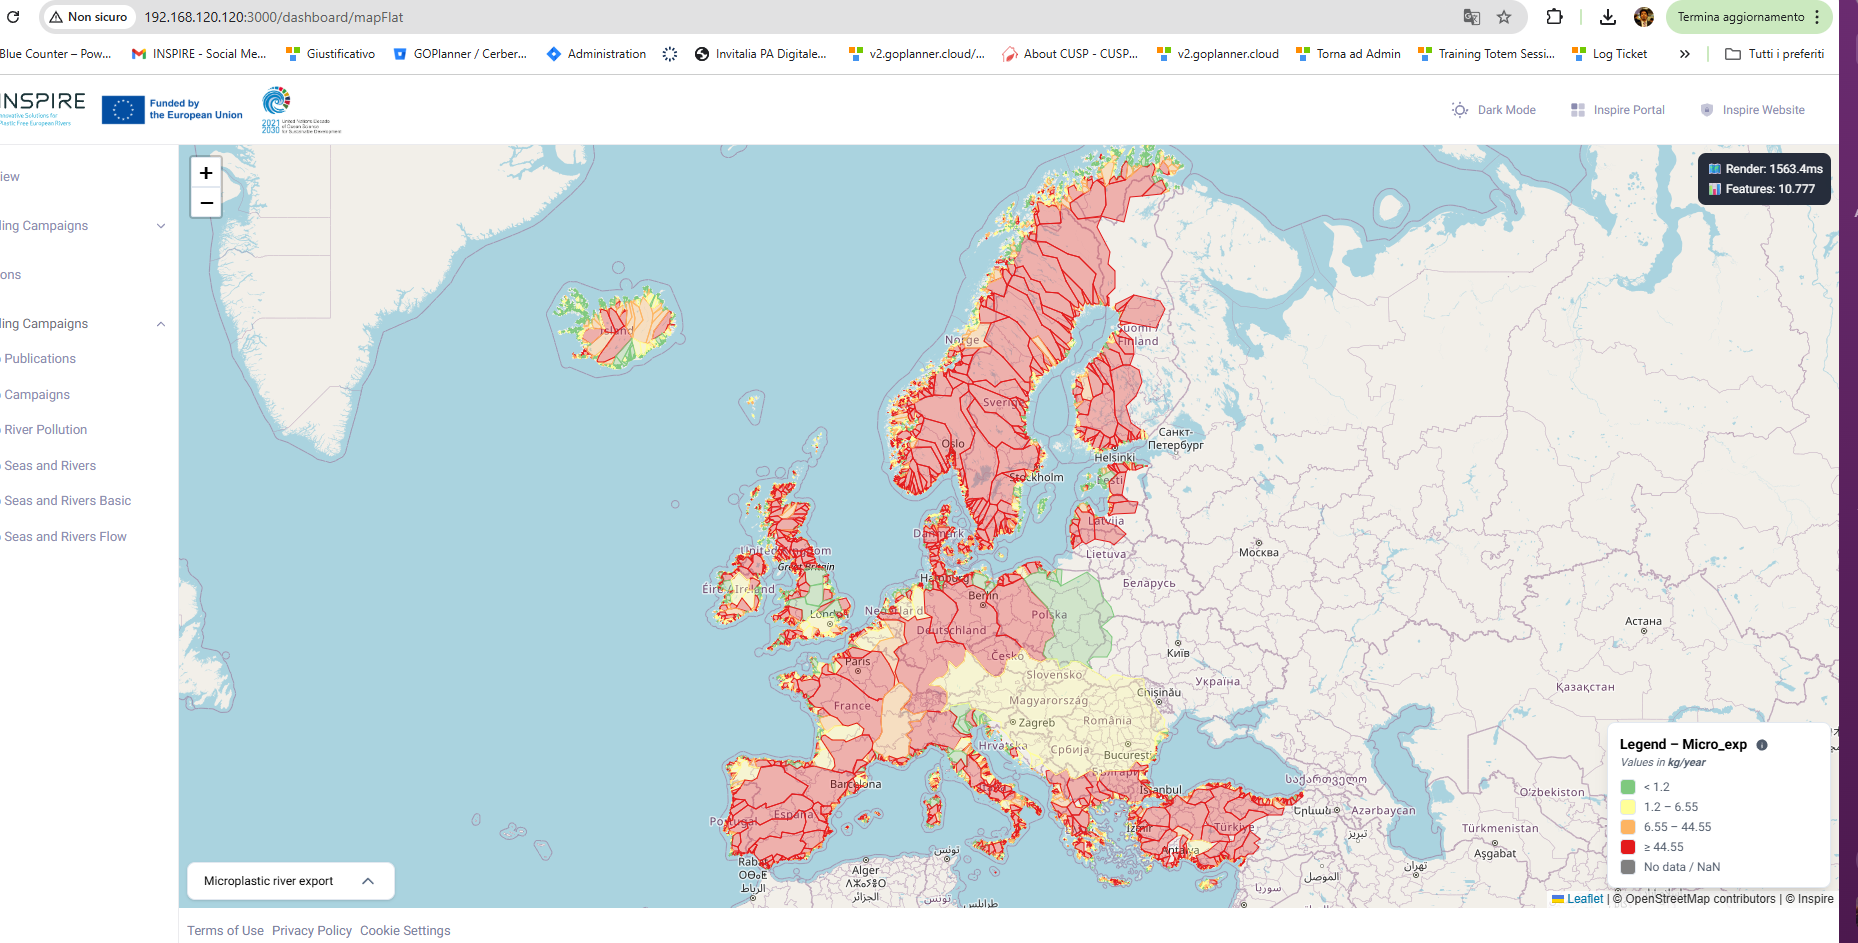
River Pollution2
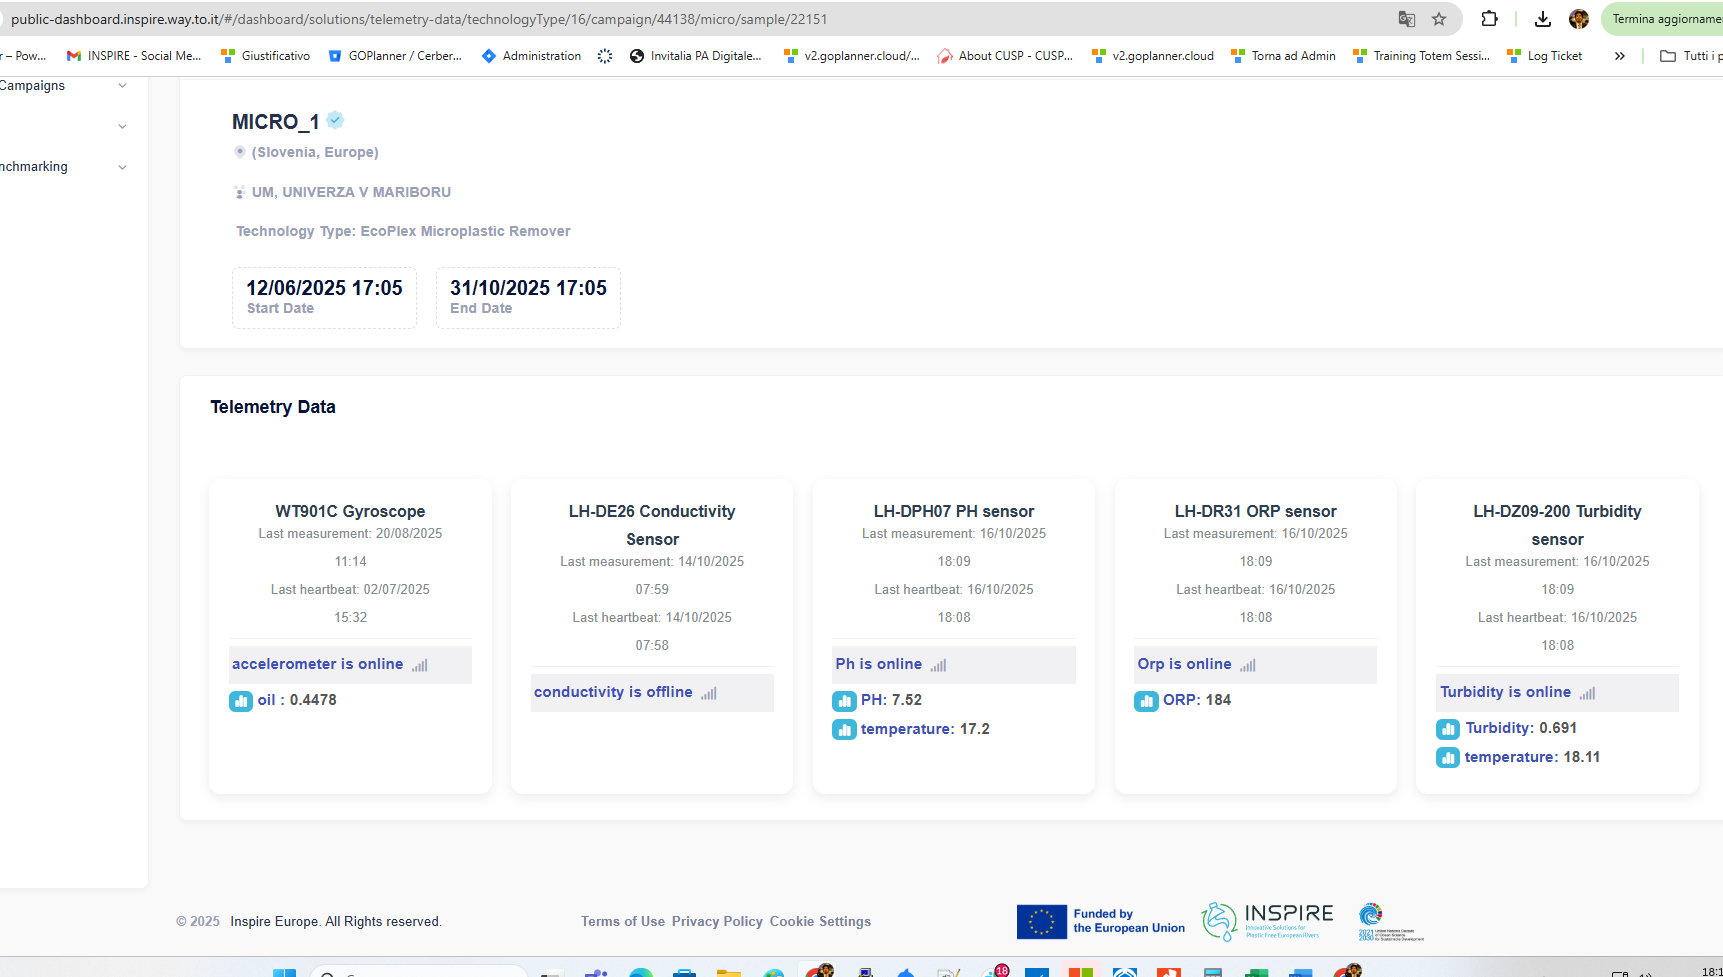
Technology monitoring with sensors
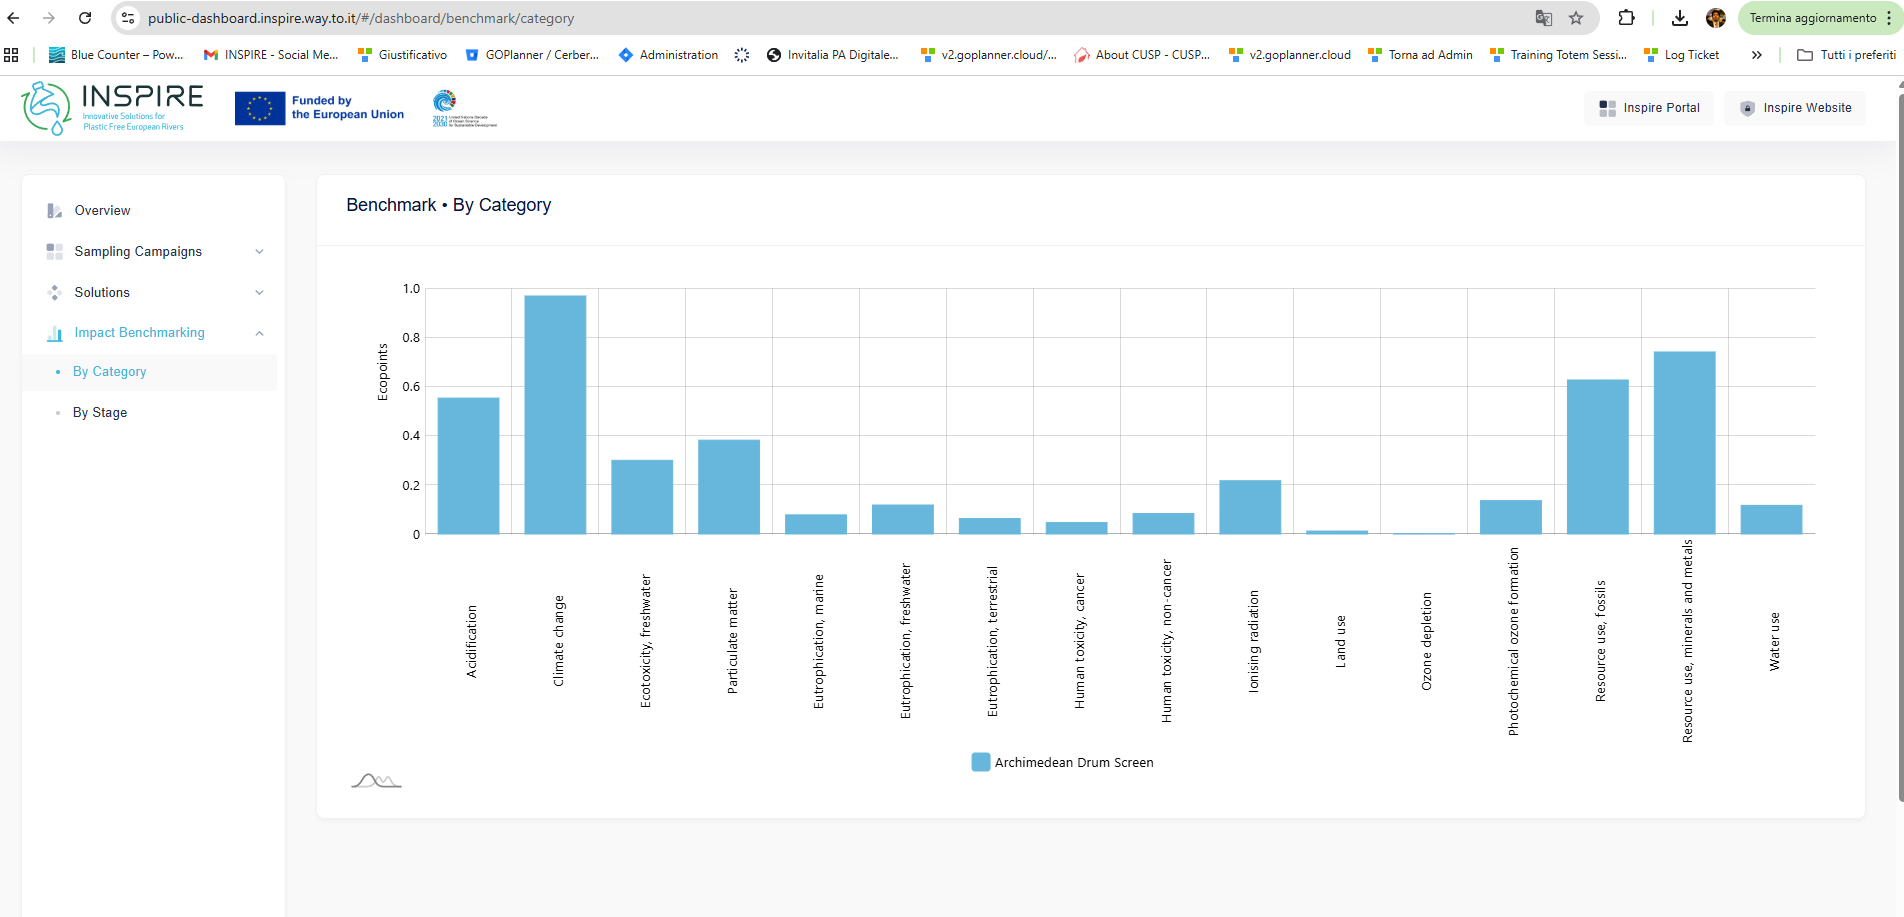
At a glance (benefits)
- One place for multi-source ML data, harmonized and FAIR.
- Real-time operational visibility from field technologies.
- Comparable KPIs for benchmarking detection and collection solutions.
- Advanced visualization (3D globe, animated transport) for rapid insight.
- Standards-compliant formats and APIs for easy integration.